Most teams don’t struggle with running an NPS survey. They struggle with what happens after the responses come in.
You end up with a spreadsheet full of scores and comments, a deadline for the quarterly report, and a nagging feeling that the “real” insight is buried somewhere in the free-text answers nobody has time to read properly. That’s the actual bottleneck. Calculating the Net Promoter Score itself is arithmetic. Making sense of why the score looks the way it does is the part that takes hours.
This is where ChatGPT earns its keep. Used well, it can calculate your NPS score in seconds, categorize hundreds of open-ended responses in minutes, and surface patterns you’d otherwise miss by skimming. Used poorly, it just repeats back a formula you already knew.
This guide is about the difference between those two outcomes. You’ll get the exact prompts to use for NPS calculation, survey analysis, and reporting, along with the reasoning behind why they’re built the way they are, so you can adapt them instead of copying them blindly.
What NPS Actually Measures (and Why the Formula Alone Won’t Save You)
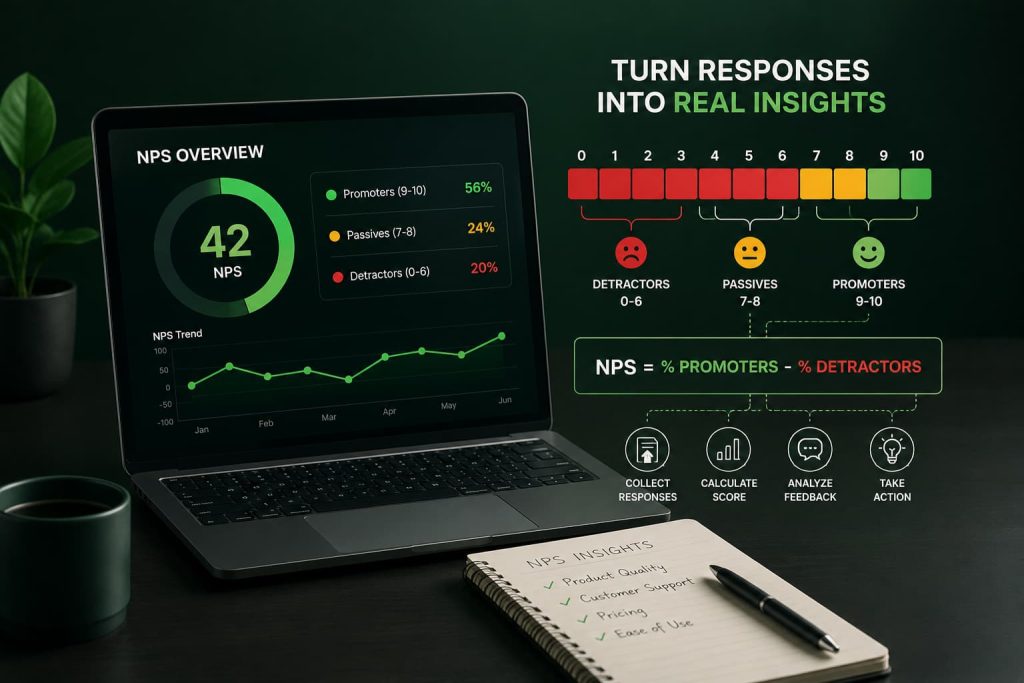
Net Promoter Score comes from one question: “How likely are you to recommend [company/product] to a friend or colleague?” on a scale of 0 to 10.
Respondents get sorted into three groups:
- Promoters (9–10): loyal enthusiasts who’ll keep buying and refer others.
- Passives (7–8): satisfied but unenthusiastic customers, vulnerable to competitive offers.
- Detractors (0–6): unhappy customers who can damage your brand through negative word-of-mouth.
The net promoter score formula is simple:
NPS = % of Promoters − % of Detractors
That gives you a number between -100 and 100. A score above 0 is generally considered good, above 50 is excellent, and above 70 is rare territory reserved for companies like Apple or Costco.
Here’s what most articles on customer satisfaction score calculation skip: the number is almost meaningless without context. An NPS of 30 could be a strong result in a notoriously low-scoring industry like cable providers, or a mediocre one in an industry where 60+ is the norm, like software. Benchmarking against your own history and your specific industry matters more than the raw figure.
This is also where ChatGPT becomes genuinely useful instead of just convenient. It’s not just doing the subtraction. It’s helping you contextualize what that subtraction means.
Why Use ChatGPT for NPS Calculation and Analysis?
You could calculate NPS in Excel with a couple of COUNTIF formulas. So why bring an AI model into it at all?
Three reasons, in practice:
Speed on repetitive segmentation. If you’re breaking NPS down by plan tier, region, customer tenure, or acquisition channel, doing that manually in a spreadsheet each quarter gets tedious fast. A well-built prompt turns raw data into a segmented breakdown almost instantly.
Qualitative analysis at scale. The score tells you what customers think. The written comments tell you why. Reading through 400 open-ended responses by hand isn’t realistic for most teams, but ChatGPT can cluster comments into themes, tag sentiment, and pull out representative quotes in a fraction of the time.
Turning numbers into a narrative. Executives don’t want a table. They want to know what’s driving the number and what to do about it. ChatGPT is well-suited to converting a data analysis prompt output into a clear written summary, provided you guide it carefully. The same underlying skill shows up in ChatGPT prompts for market research: the model isn’t gathering the data for you, it’s helping you make sense of what you already collected.
What ChatGPT is not good at: being your source of truth for raw computation on large datasets, or making strategic decisions for you. Treat it as an analyst who works fast and needs clear direction, not an oracle.
Before You Prompt: Get Your Data Ready
A prompt is only as good as the data behind it. Two formats work well with ChatGPT:
- Paste the raw scores directly into the chat if you’re working with a small dataset (under a few hundred responses).
- Upload a CSV or Excel file if you’re using ChatGPT Plus or Enterprise with file upload enabled, which is the better option for anything larger.
Either way, make sure your data includes, at minimum: the NPS score (0–10), and ideally a timestamp, customer segment, and the open-ended follow-up comment. The more structured your input, the more useful the output.
The Core ChatGPT Prompt for NPS Calculation
This is your starting point. It’s built to not just calculate the score, but to explain the breakdown so you’re not just trusting a black box.
Act as a customer experience data analyst. I’m going to share a dataset of NPS survey responses (score from 0–10). Please do the following:
- Classify each response as a Promoter (9–10), Passive (7–8), or Detractor (0–6).
- Calculate the percentage of respondents in each category.
- Calculate the overall NPS score using the formula: % Promoters − % Detractors.
- Show your calculation step by step so I can verify the math.
- Note the total number of responses used.
Here is the data: [paste or describe your data here]
Notice the instruction to “show your calculation step by step.” That single line matters more than people realize. Without it, ChatGPT will sometimes just hand you a final number with no visible working, and you have no easy way to catch an error in how it interpreted your data. Asking it to show its work turns the output into something you can actually audit.
Prompt for Segmented NPS Analysis
Once you have the overall score, the more useful question is usually: where is it strongest, and where is it weakest?
Using the same NPS dataset, break down the NPS score by [segment, e.g., customer plan tier / region / signup cohort]. For each segment, provide:
- Number of respondents
- % Promoters, % Passives, % Detractors
- NPS score for that segment
Then rank the segments from highest to lowest NPS and flag any segment with fewer than 20 responses as having a small sample size warning.
That last instruction, flagging small sample sizes, is one most people forget to ask for. A segment with 8 responses and one detractor can swing wildly and mislead you into thinking there’s a trend when there’s really just noise. Building that guardrail into the prompt keeps the analysis honest.
Prompt for NPS Survey Response Analysis (Qualitative)
This is where the real value tends to show up, because it’s the part that would otherwise take hours of manual reading.
I have a set of open-ended comments from an NPS survey, paired with each respondent’s score category (Promoter, Passive, Detractor). Please:
- Identify the 5–7 most common themes across all comments.
- For each theme, note whether it appears more among Promoters, Passives, or Detractors.
- Pull 2–3 representative quotes per theme (verbatim from the data provided).
- Flag any themes that appear in both Promoter and Detractor comments, since these often point to inconsistent experiences rather than a single clear-cut issue.
Comments: [paste comments here]
That fourth instruction is worth explaining. In practice, the most actionable insight in an NPS analysis often isn’t “everyone complains about X.” It’s “some customers love X and others hate it,” which usually means the experience is inconsistent rather than universally broken. That’s a different problem to solve, and a generic prompt won’t surface it unless you specifically ask for it.
Prompt for NPS Dashboard Insights and Executive Summary
Once the analysis is done, someone still has to write the summary that goes in front of leadership. This is a good use of ChatGPT precisely because it removes the blank-page problem, not because it should replace your judgment about what actually matters.
Based on the NPS calculation and theme analysis above, write a concise executive summary (under 200 words) that includes:
- The overall NPS score and how it compares to [last quarter’s score / industry benchmark, if known]
- The single biggest driver of Detractor scores
- The single biggest driver of Promoter scores
- One clear, specific recommendation for the next quarter
Write in plain, direct language. Avoid vague statements like “customers want better service” — be specific about what “better” means based on the data.
That last line is doing a lot of work. Left unguided, AI-generated executive summaries tend to drift toward generic, safe-sounding statements that don’t actually say anything. Telling it explicitly to avoid vague language and be specific is often the difference between a summary that gets nodded at in a meeting and one that actually changes what the team does next week.
Common Mistakes When Using ChatGPT for NPS Analysis
Trusting the math without a spot check. Even with a step-by-step breakdown, it’s worth manually verifying the calculation against a small sample of your data, especially the first few times. Large language models are good at reasoning through the classification logic but can occasionally miscount when the dataset is large and pasted as unstructured text. A five-minute spot check is cheap insurance.
Not accounting for response bias. If only your happiest or angriest customers respond to surveys, and response rate hovers around 15–20% as it does for most companies, your NPS may not represent your full customer base. This is a research design problem, not something a better prompt fixes, but it’s worth stating clearly in any report so nobody mistakes the score for a complete picture.
Feeding it too much at once. Pasting 2,000 rows of raw data into a single message tends to produce shallower analysis than breaking the work into stages: calculate first, segment second, analyze comments third. Smaller, focused prompts consistently outperform one giant prompt trying to do everything.
Treating the theme analysis as final. ChatGPT is good at surfacing patterns in language, but it doesn’t know your product roadmap, your competitive landscape, or last quarter’s context. Use its output as a first draft of the story, then apply your own judgment before it goes anywhere near a stakeholder deck.
A Worked Example
Say you collected 150 NPS responses last quarter. Running the classification, you get:
- 84 Promoters (56%)
- 42 Passives (28%)
- 24 Detractors (16%)
NPS = 56 − 16 = 40
That’s a solid score for most B2B SaaS companies, where average NPS tends to sit somewhere in the 30–40 range depending on the source. But the number alone tells you almost nothing about what to do next. Running the comment-analysis prompt on the same dataset might reveal that Detractor comments cluster heavily around onboarding friction, while Promoter comments consistently mention responsive support. That’s the actual insight, and it’s the kind of thing a plain average would never surface.
When AI-Assisted NPS Analysis Isn’t Enough
There’s a point where prompting ChatGPT stops being the right tool. If you’re running NPS across tens of thousands of responses monthly, a dedicated CX analytics platform with statistical significance testing and trend tracking will serve you better than repeated manual prompting. ChatGPT is excellent for quarterly analysis, ad hoc deep dives, and teams that don’t have a dedicated analytics budget. It’s not a replacement for purpose-built survey tooling once you’re operating at real scale.
Knowing where that line sits, and being honest about it internally, is part of using the tool well rather than reaching for it out of habit.
The Takeaway
The formula behind NPS has never been the hard part. The hard part is turning a single number into a decision your team can act on before the next survey cycle rolls around. Used with the right prompts, ChatGPT collapses hours of manual sorting and reading into minutes, and it does the one thing spreadsheets never will: it reads every comment, every time, without getting tired of it by response 200. The score tells you where you stand. The comments tell you why. Build your process around both, and the number stops being a vanity metric and starts being a genuine early warning system.